
Home > About > Statistics
Statistics
The statistics on this page are organized in two sections showing Global Impact and Ontology Data. Additional statistics showing the latest traffic at the HumanDiseaseOntology GitHub repo can be viewed here.
Global Impact
Sub-continents with Biomedical Resources using the DO
The number of biomedical resources identified since 2008 that use the Disease Ontology and grouped
by sub-continent are shown. These resources are identified primarily from publications citing the DO, tallied by
country of origin and then grouped by sub-continent, with resources created by researchers in more than one
sub-continent included in the count of each. The list of individual biomedical resources can be found on the
Use Cases page.
Total sub-continents = 15; Total countries = 48; Total biomedical resources = 479.

|

|
Sub-continents with Users Accessing disease-ontology.org
The "new users" to disease-ontology.org by sub-continent are shown, as assessed with Google Analytics.
Beginning July 2023 (Google Analytics 4)
Total sub-continents = 20; Total countries = 168; Total new users = 105,370.

|

|
2011 - June 2023 (Google Universal Analytics)
Total sub-continents = 22; Total countries = 201; Total new users = 229,769.
Note: This data includes 1,267 users from "Unknown" sub-continents and "not set" countries.

|

|
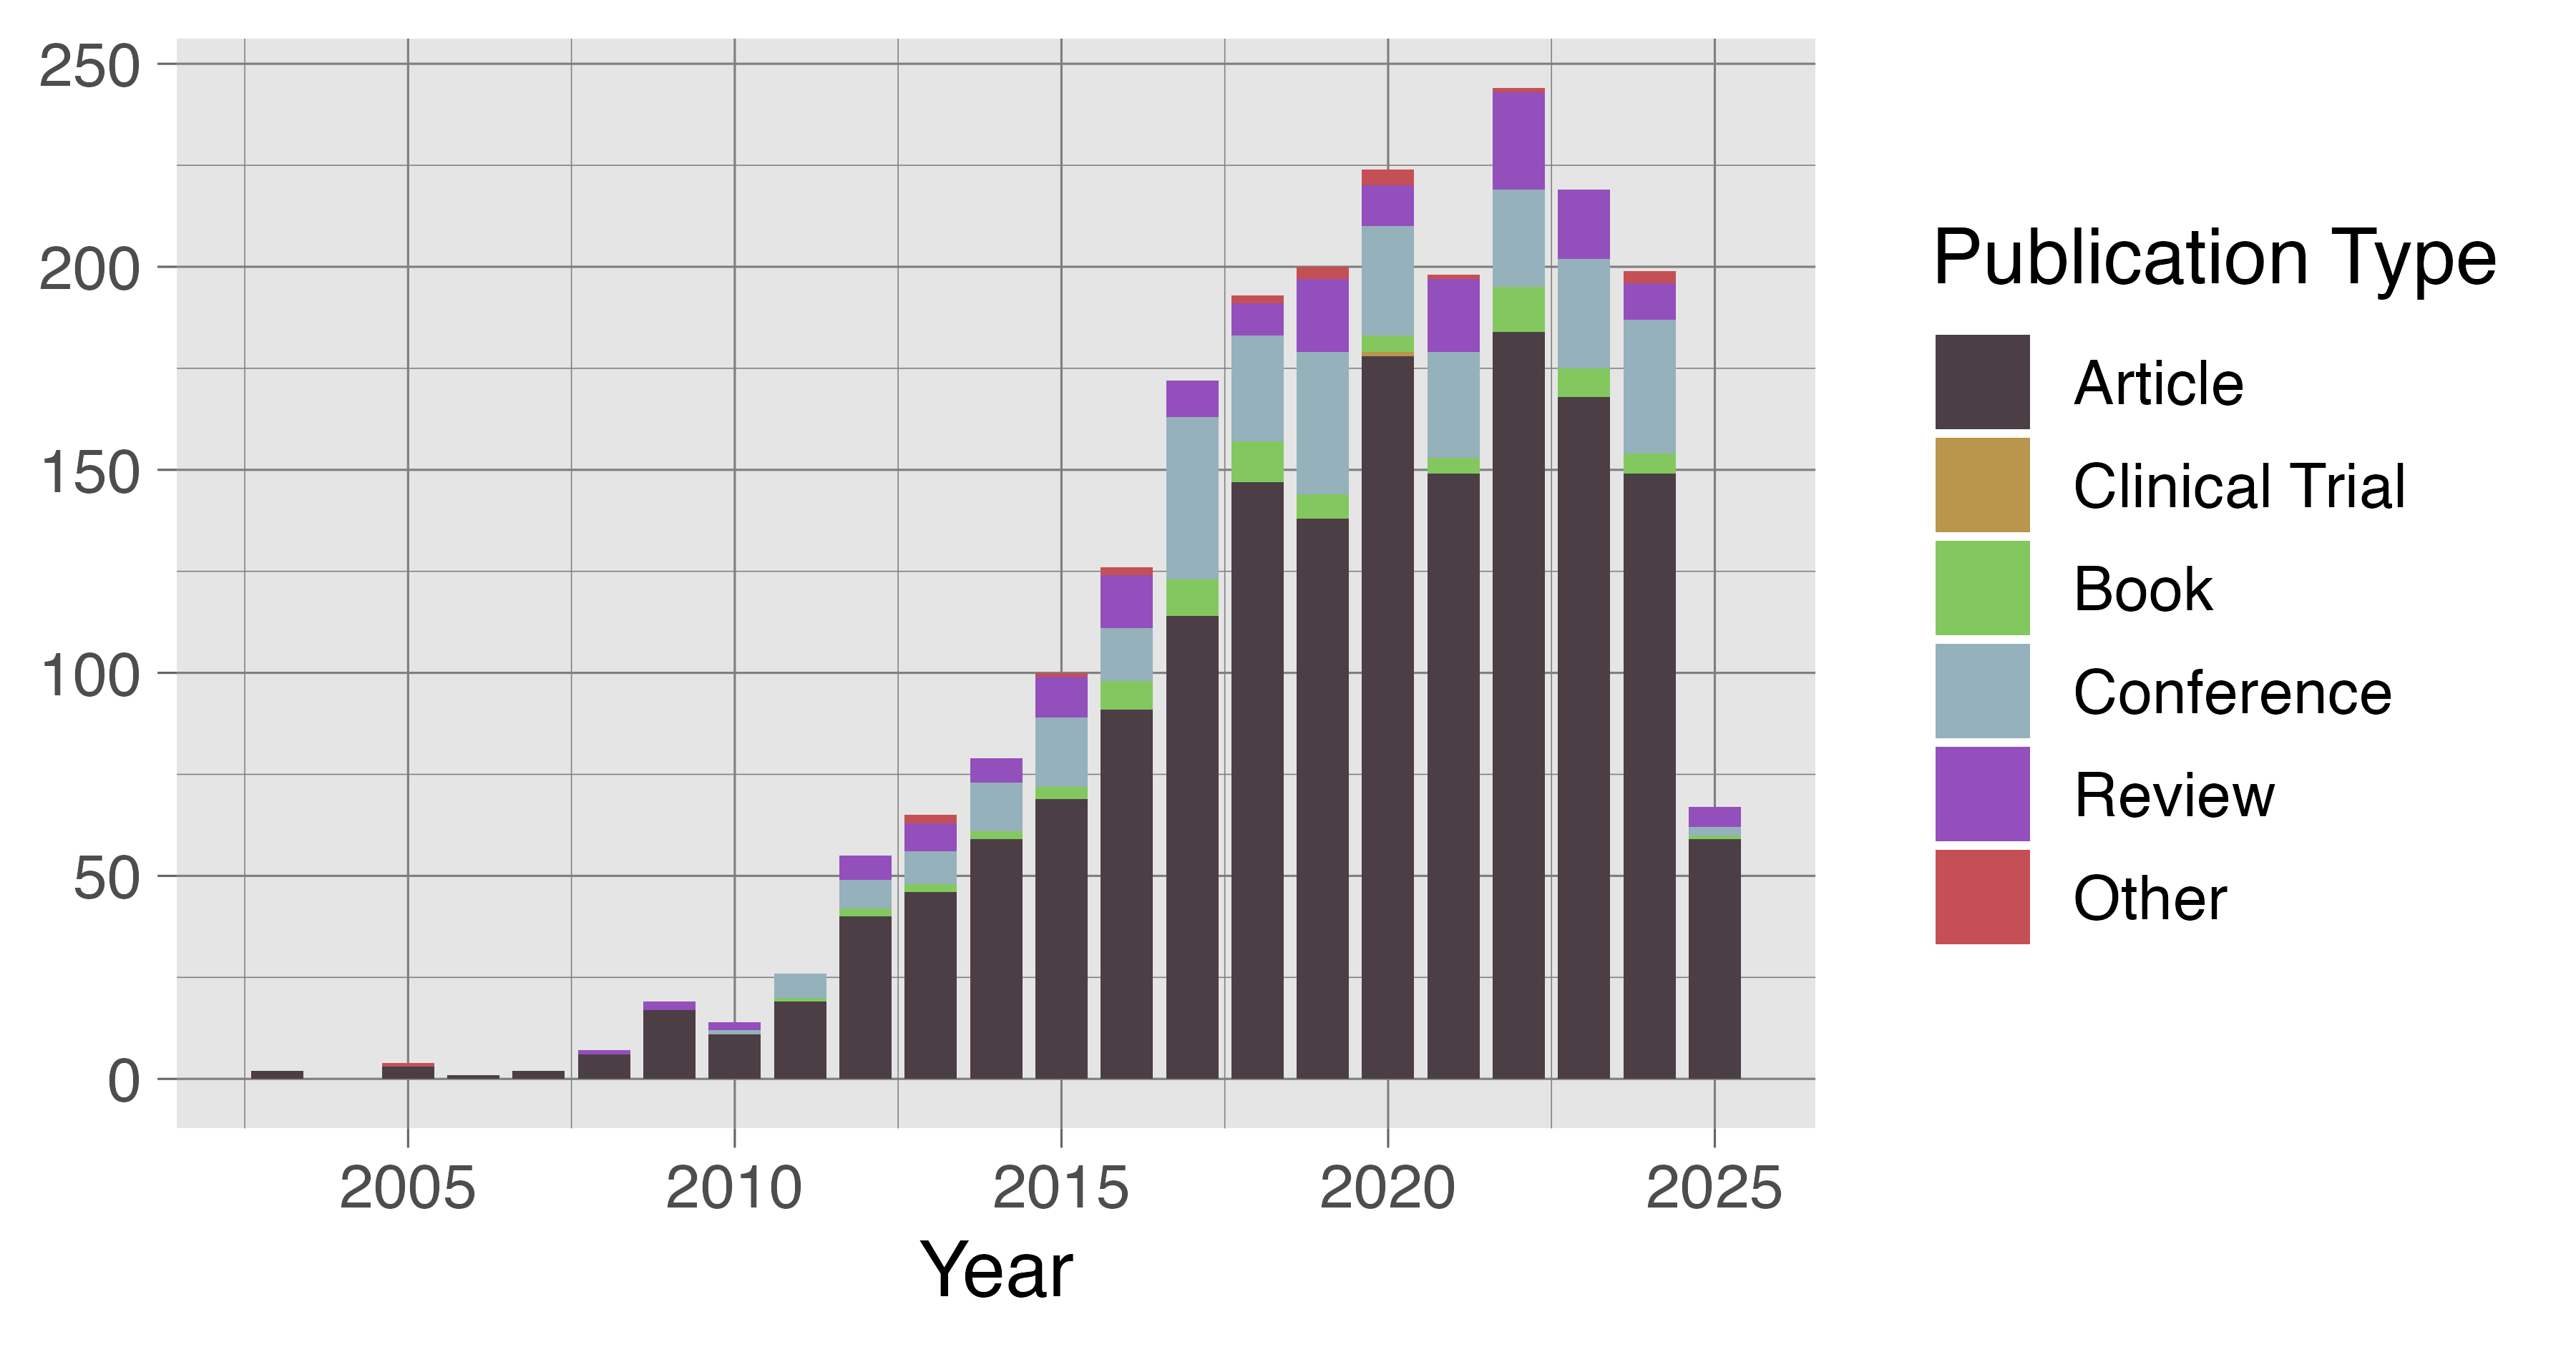
Publications Citing the Disease Ontology Each Year
Total = 2,431
Ontology Data
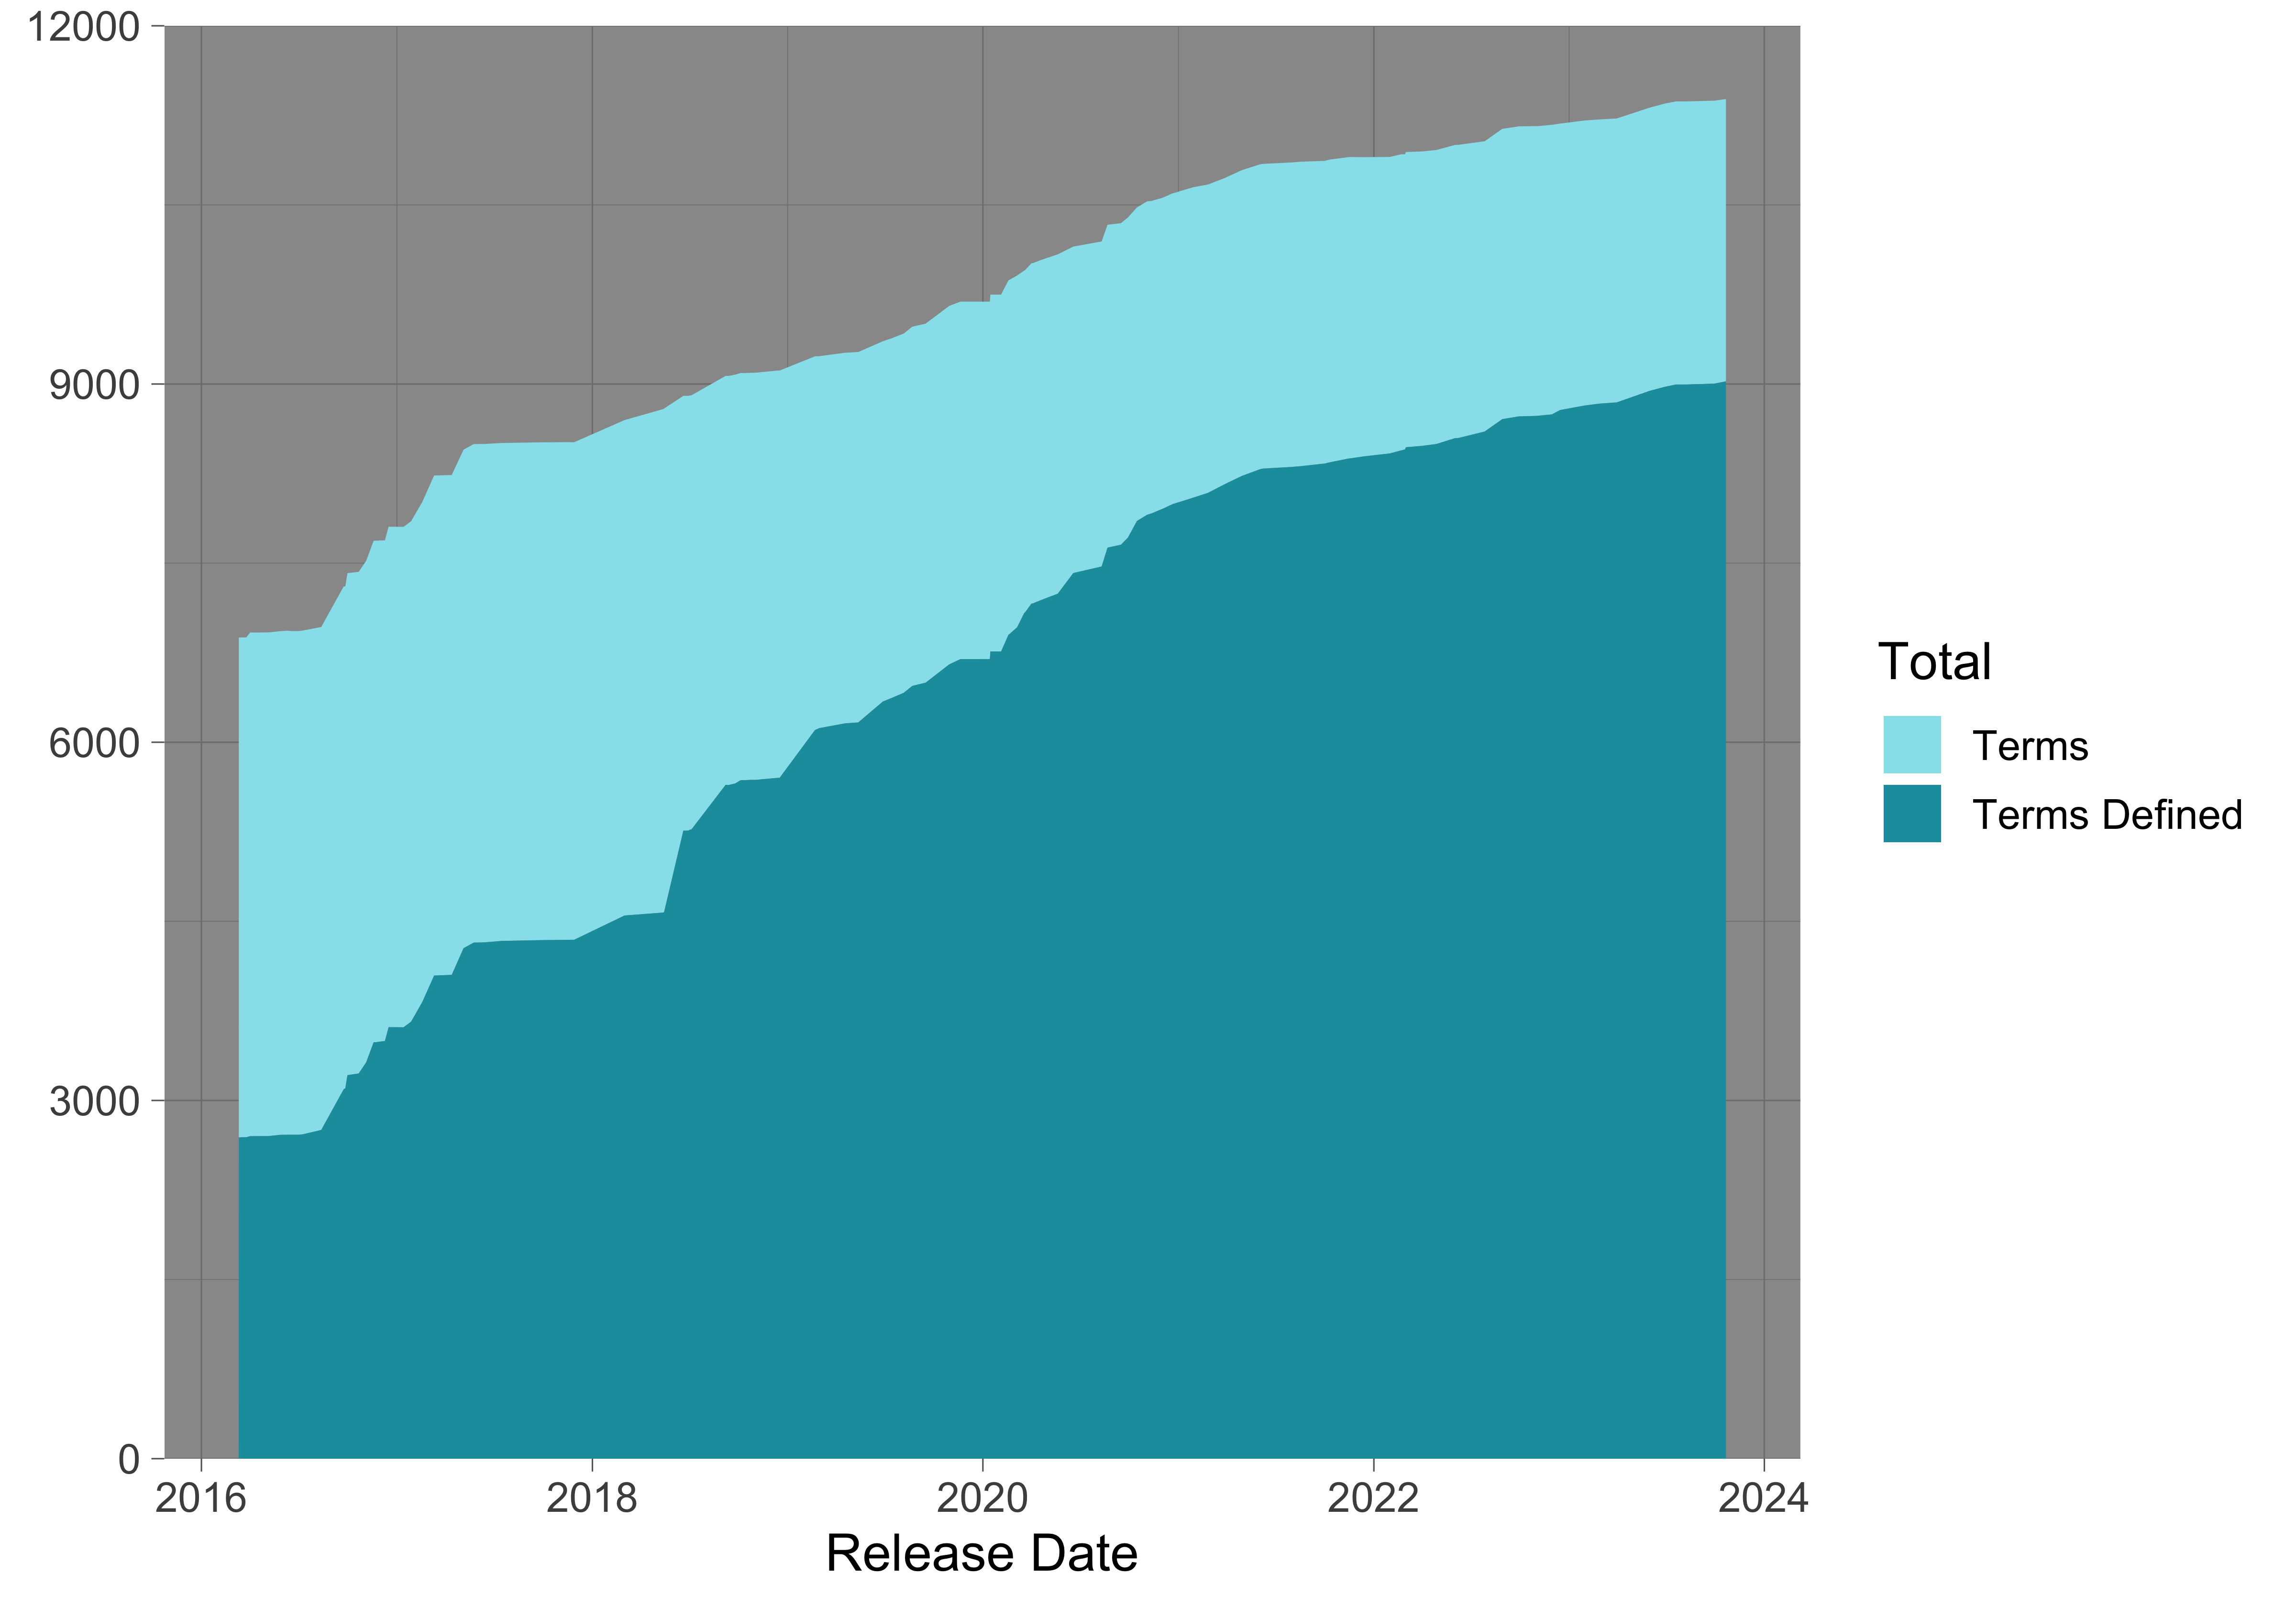
Disease Ontology Terms and Definitions by Release
|
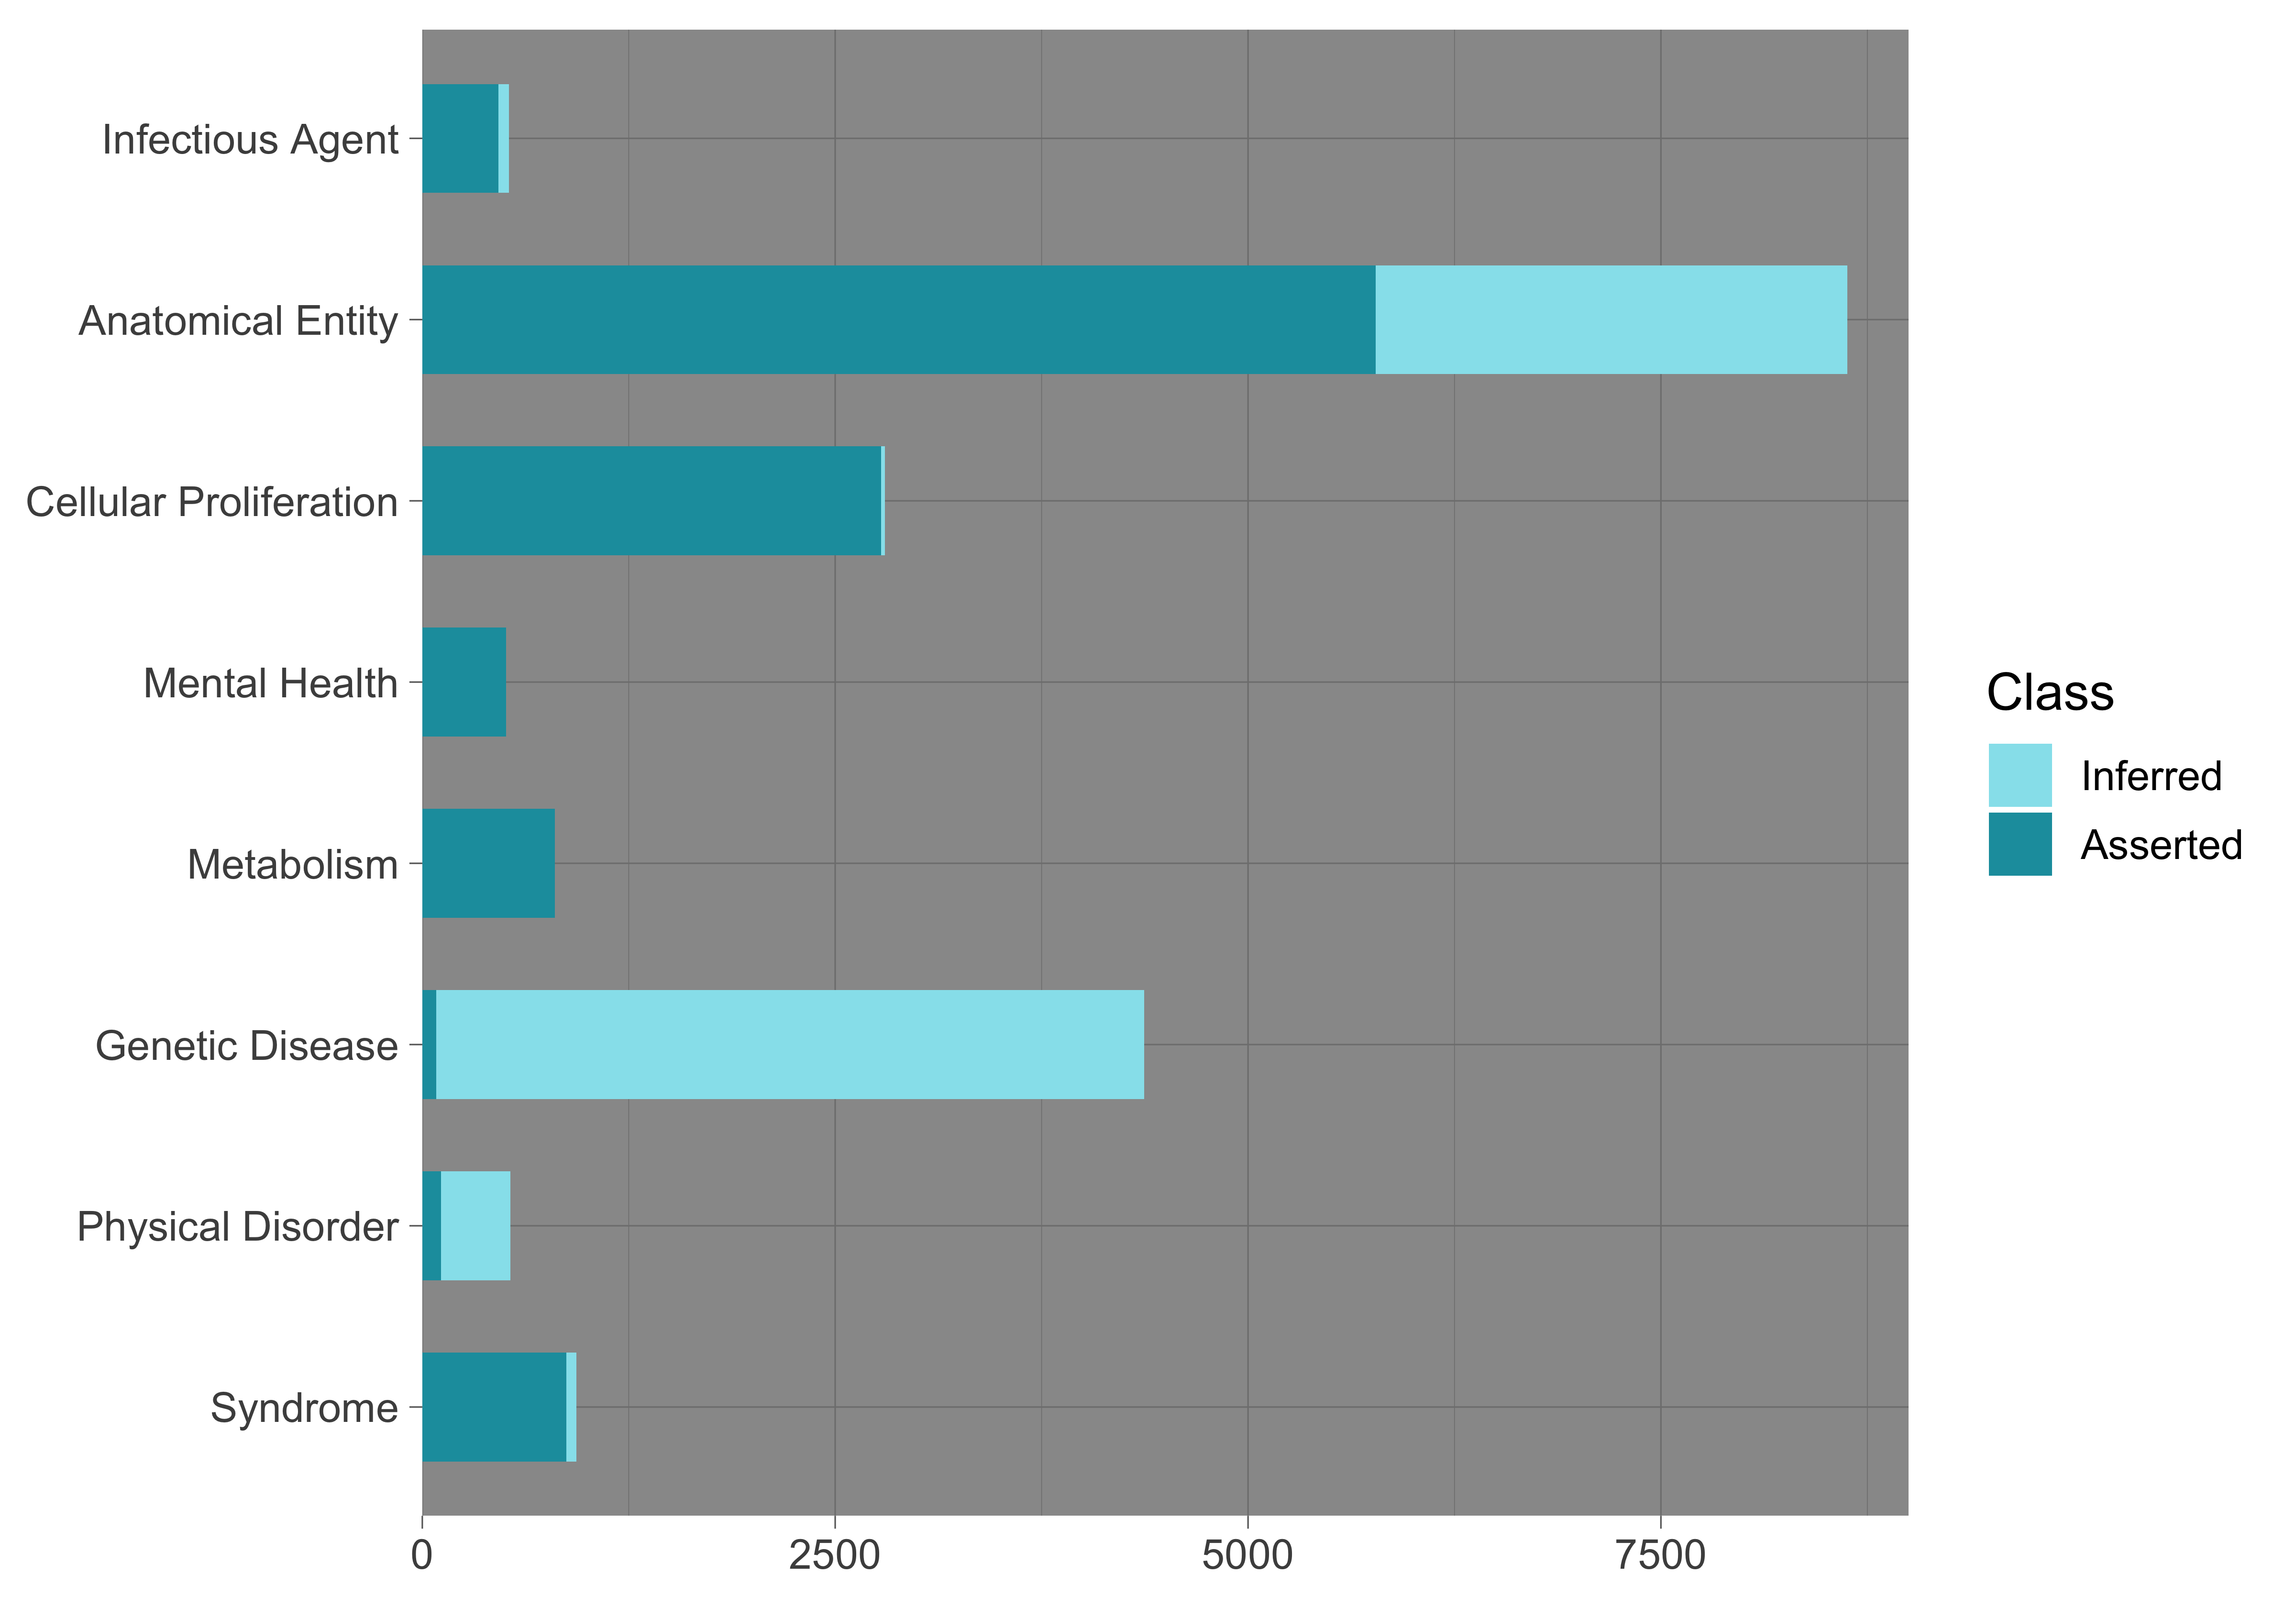
Disease Ontology Branch Counts
|
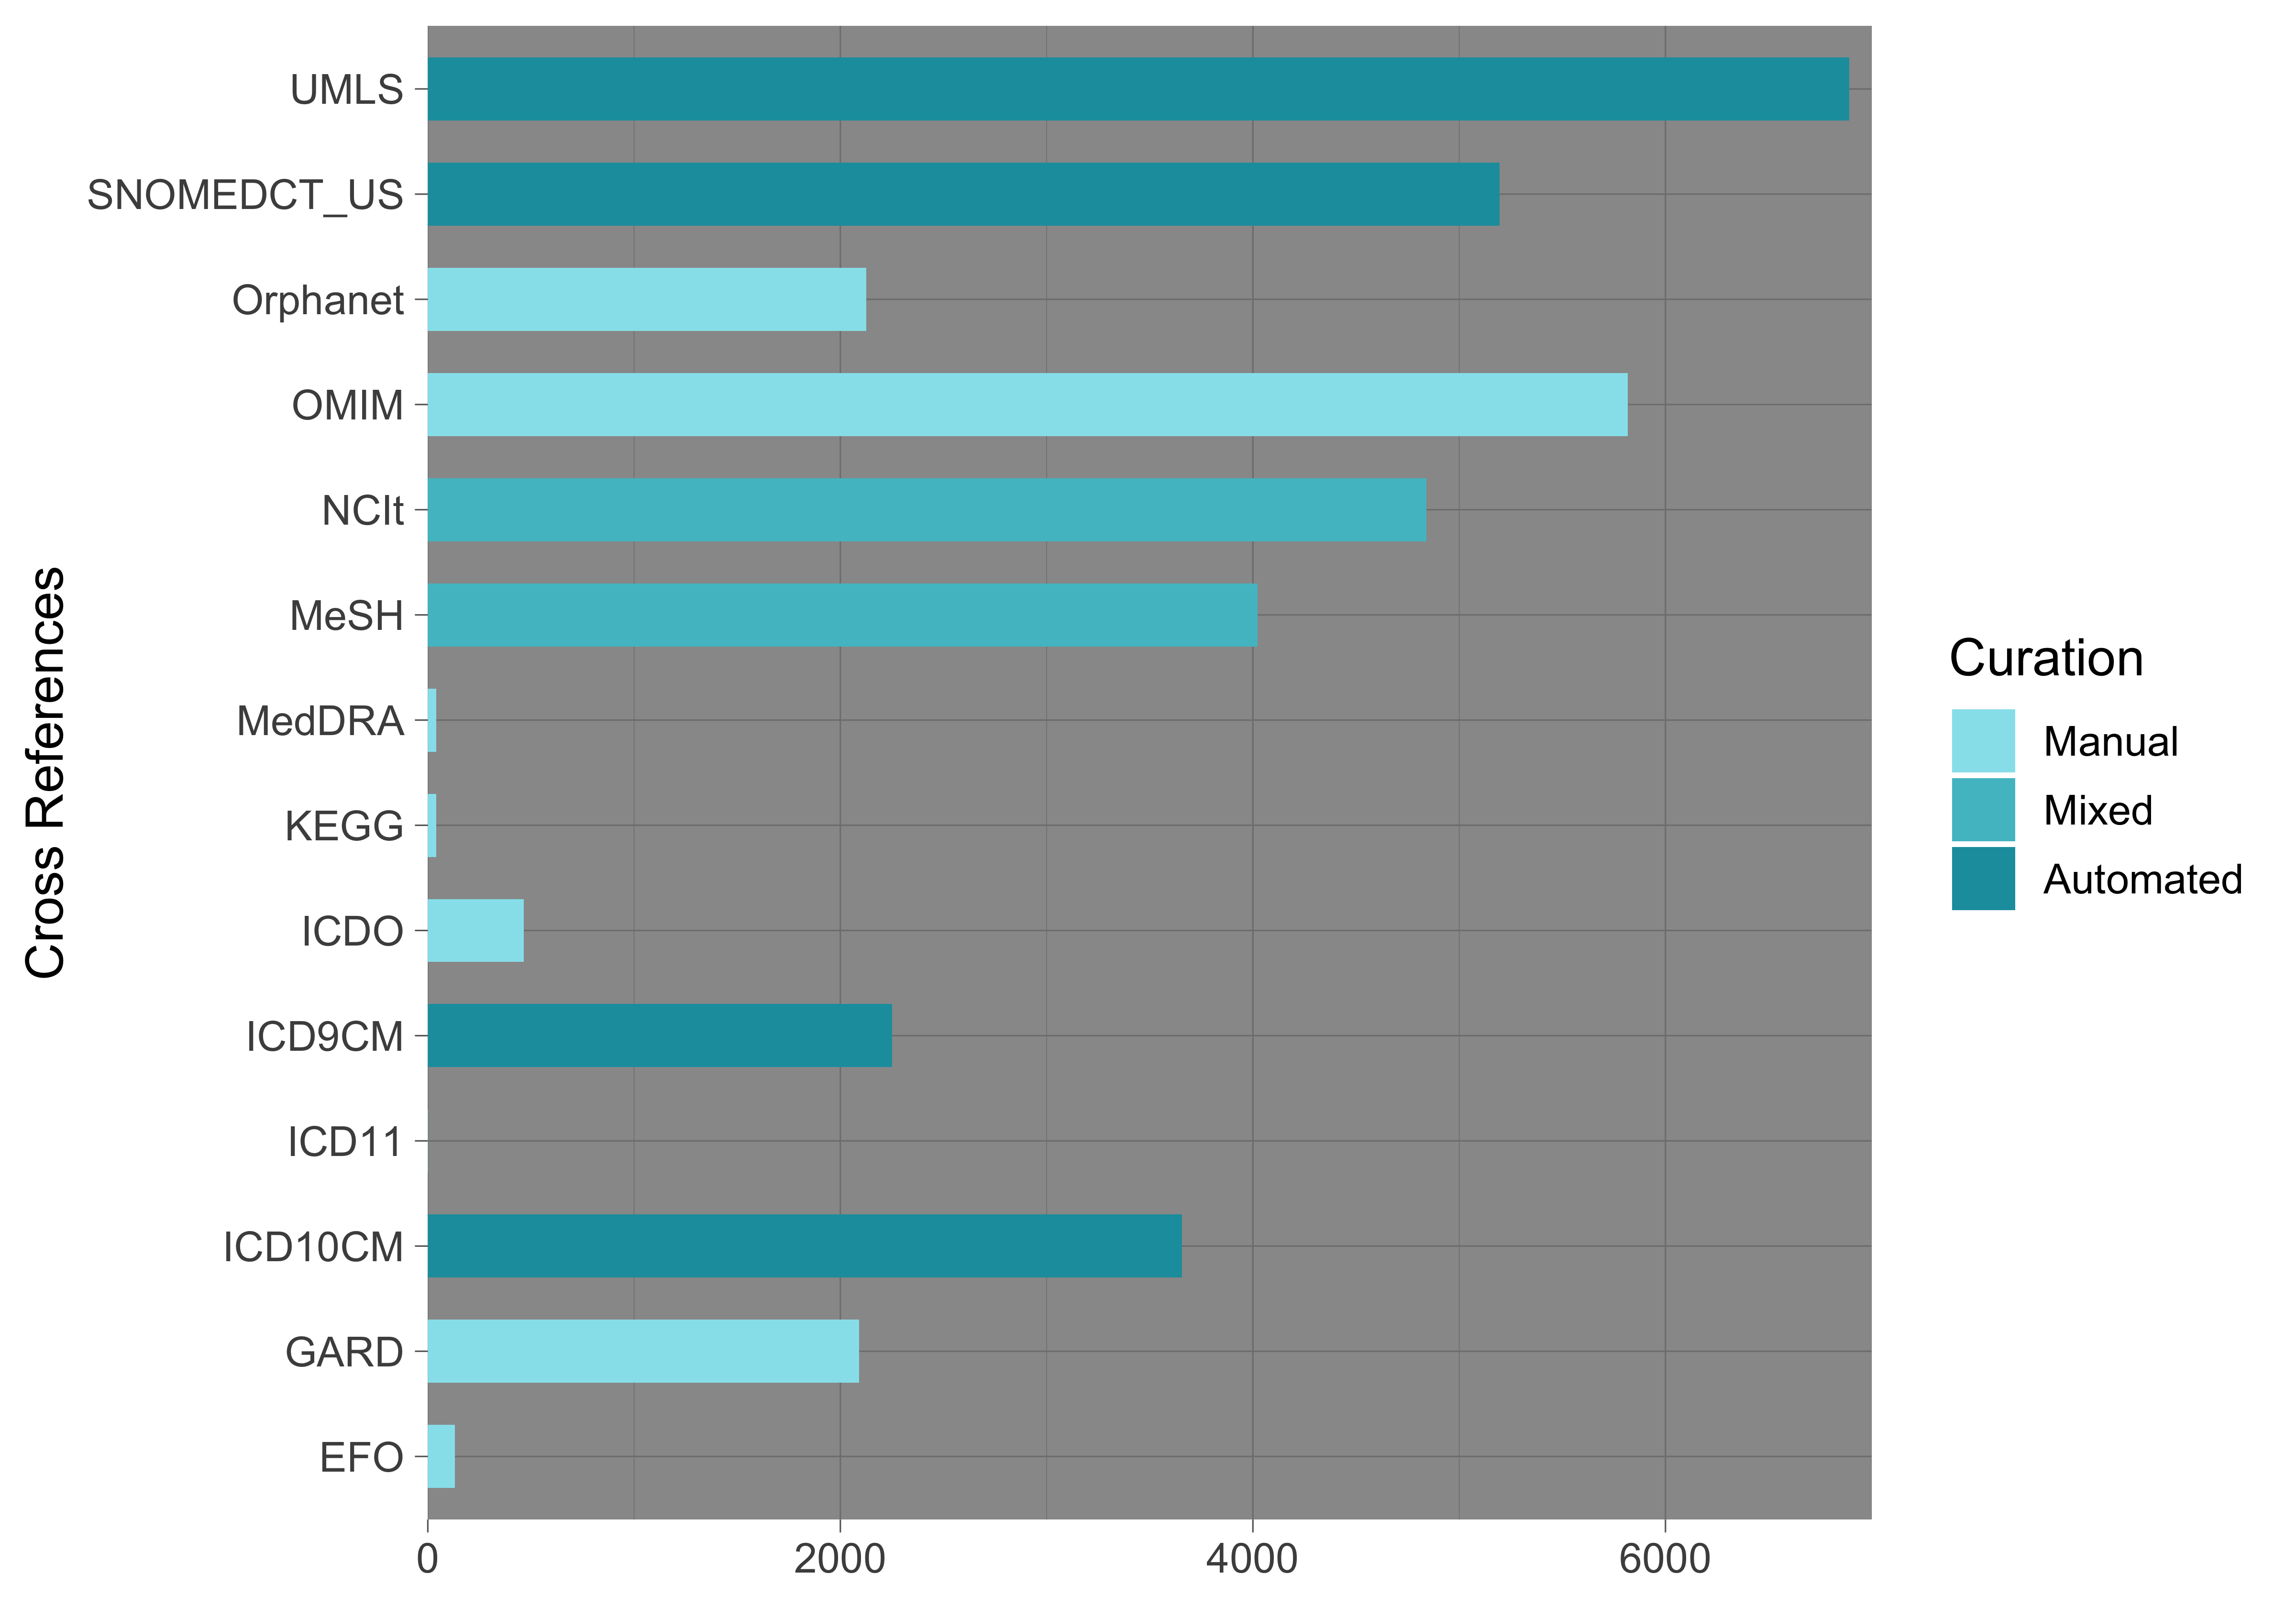
Disease Ontology Cross-References
|
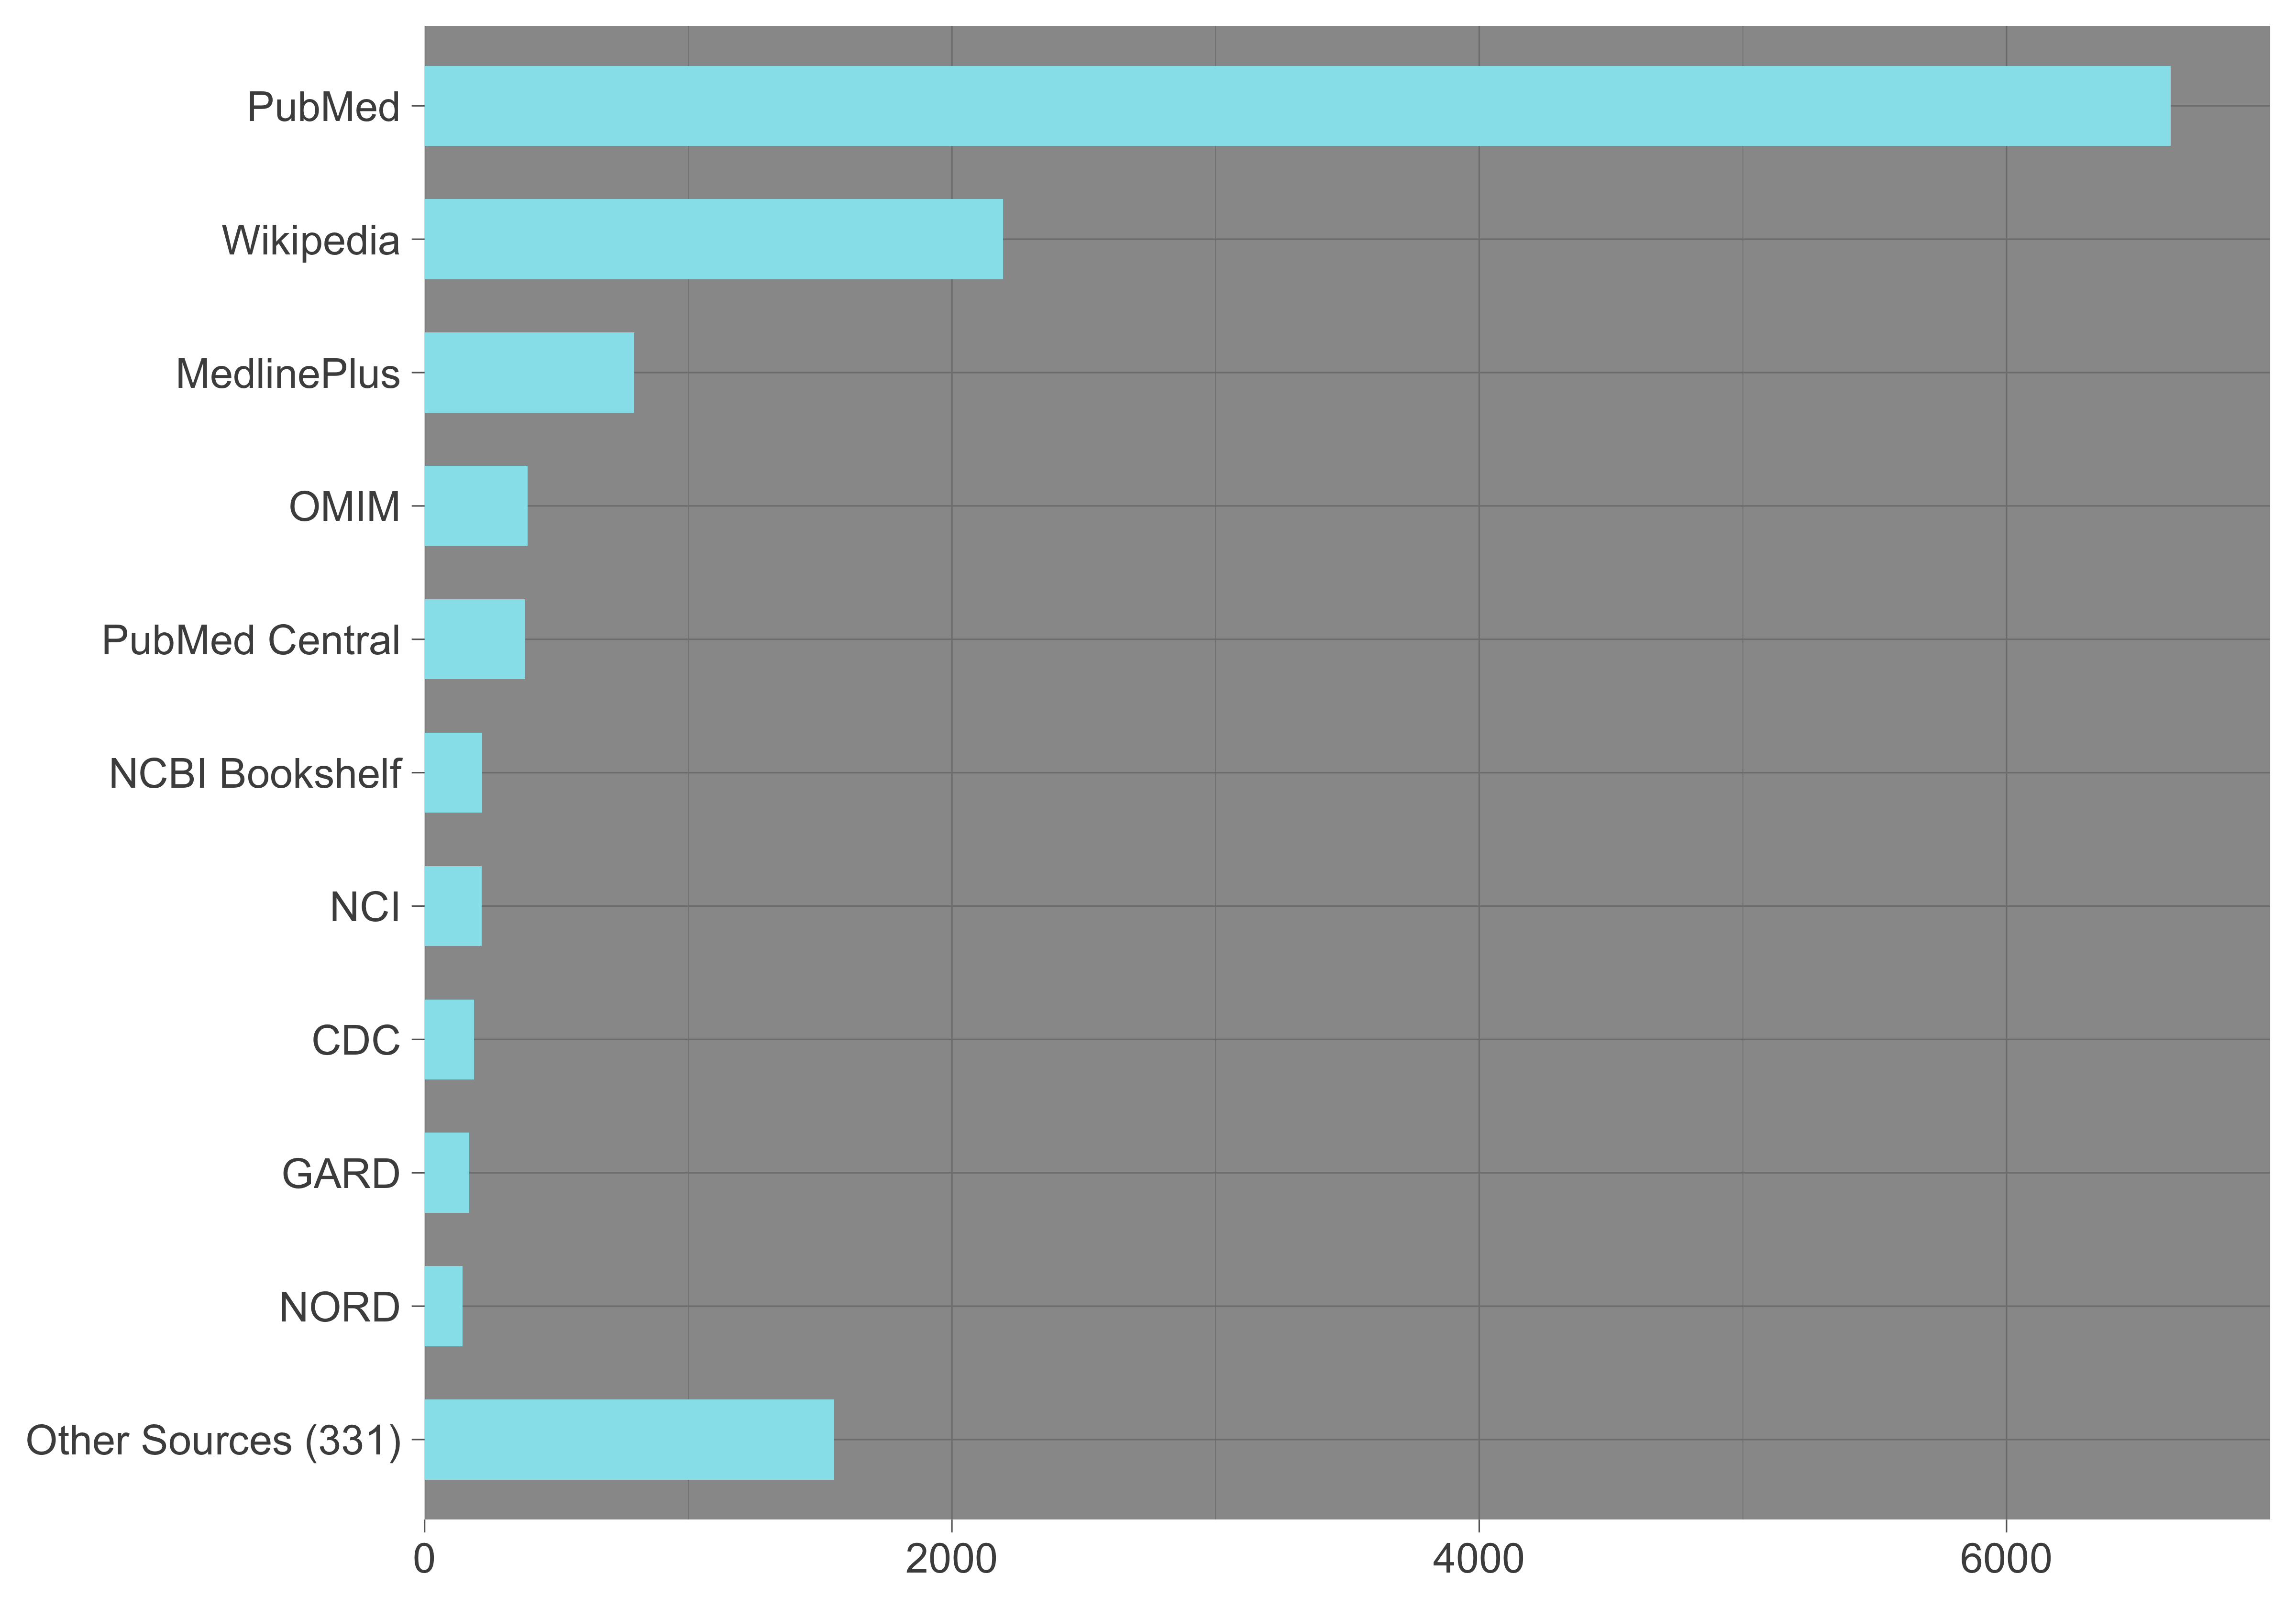
Disease Ontology Definition Source Counts
|